Introduction
What is Machine Learning ?
What is Machine Learning?
Two definitions of Machine Learning are offered. Arthur Samuel described it as: “the field of study that gives computers the ability to learn without being explicitly programmed.” This is an older, informal definition.
Tom Mitchell provides a more modern definition: “A computer program is said to learn from experience E with respect to some class of tasks T and performance measure P, if its performance at tasks in T, as measured by P, improves with experience E.”
Machine Learning is also called Statistical Learning.
Example: playing checkers.
E = the experience of playing many games of checkers
T = the task of playing checkers.
P = the probability that the program will win the next game.
In general, any machine learning problem can be assigned to one of two broad classifications:
Supervised learning and Unsupervised learning.
Supervised Learning
Supervised Learning is probably the most common type of machine learning problem. Let’s start with an example of what is it. Let’s say we want to predict housing prices. We plot a data set and it looks like this.
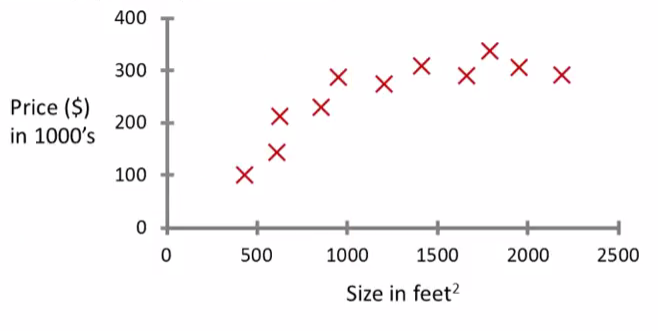
Here on the horizontal axis, the size of different houses in square feet, and on the vertical axis, the price of different houses in thousands of dollars.
So. Given this data, let’s say we own a house that is, say 750 square feet and hoping to sell the house and we want to know how much we can get for the house.
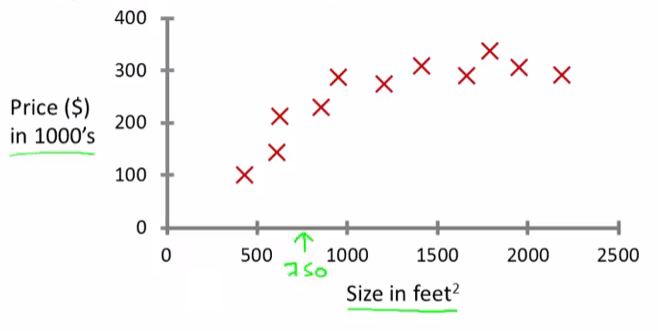
So how can the learning algorithm help?
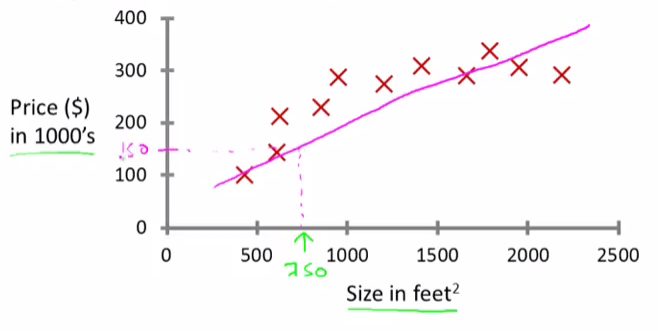
One thing a learning algorithm might be able to do is put a straight line through the data or to “fit” a straight line to the data and, based on that, it looks like maybe the house can be sold for maybe about $150,000.
But maybe this isn’t the only learning algorithm we can use. There might be a better one. For example, instead of sending a straight line to the data, we might decide that it’s better to fit a quadratic function or a second-order polynomial to this data.
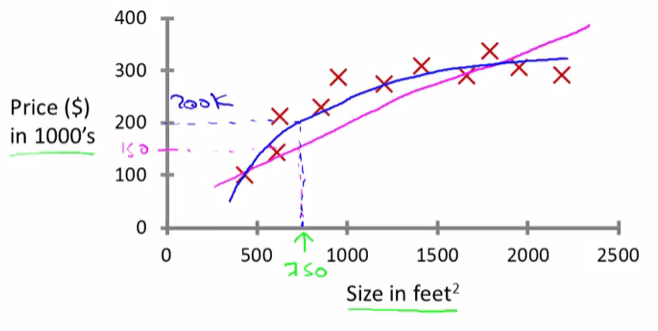
If we do that, and make a prediction here, then it looks like, well, maybe we can sell the house for closer to $200,000.
This is an example of a supervised learning algorithm.
The term supervised learning refers to the fact that we gave the algorithm a data set in which the “right answers” were given.
The example above is also called a regression problem. A regression problem is when we try to predict a continuous value output. Namely the price in the example.
Here’s another supervised learning example. Let’s say we want to look at medical records and try to predict of a breast cancer as malignant or benign. If someone discovers a breast tumor, a lump in their breast, a malignant tumor is a tumor that is harmful and dangerous and a benign tumor is a tumor that is harmless. Let’s see a collected data set and suppose in the data set we have the size of the tumor on the horizontal axis and on the vertical axis we plot one or zero, yes or no, whether or not these are examples of tumors we’ve seen before are malignant (which is one) or zero if not malignant or benign.
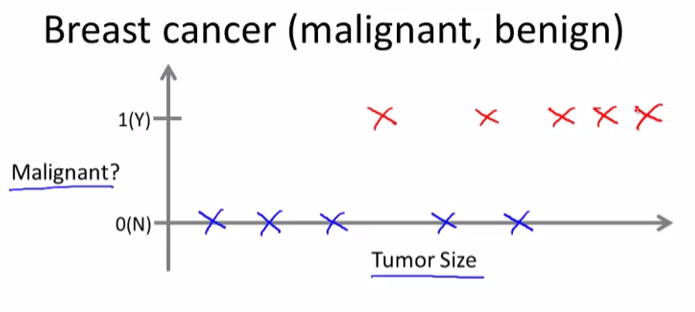
In this data set we have five examples of benign tumors, and five examples of malignant tumors.
Let’s say a person who tragically has a breast tumor, and let’s say her breast tumor size is known (rose arrow in the following figure).
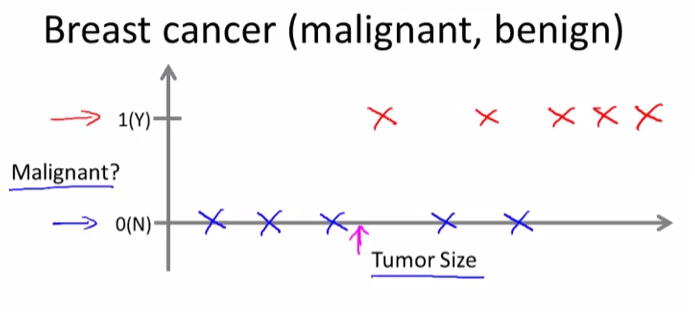
The machine learning question is, can you estimate what is the probability that a tumor is malignant versus benign? To introduce a bit more terminology this is an example of a classification problem.
The term classification refers to the fact that here we’re trying to predict a discrete value output: zero or one, malignant or benign. And it turns out that in classification problems sometimes you can have more than two values for the two possible values for the output.
In classification problems there is another way to plot this data. Let’s use a slightly different set of symbols to plot this data. So if tumor size is going to be the attribute that we are going to use to predict malignancy or benignness, we can also draw the data like this.
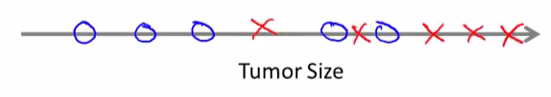
All we did was we took the data set on top and just mapped it down using different symbols. So instead of drawing crosses, we are now going to draw O’s for the benign tumors.
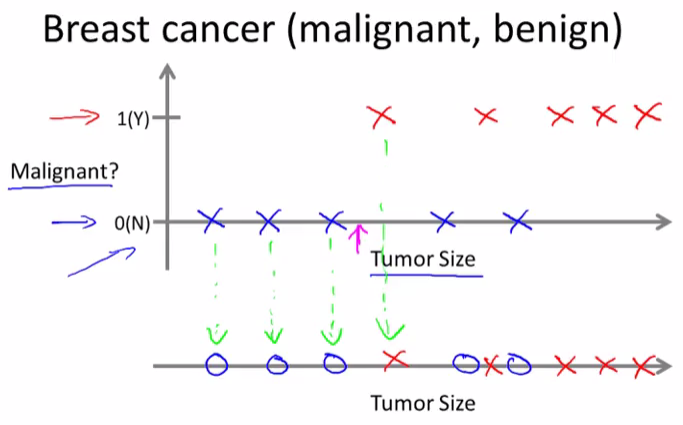
Now, in this example we use only one feature or one attribute, mainly, the tumor size in order to predict whether the tumor is malignant or benign.
In other machine learning problems we may have more than one feature.
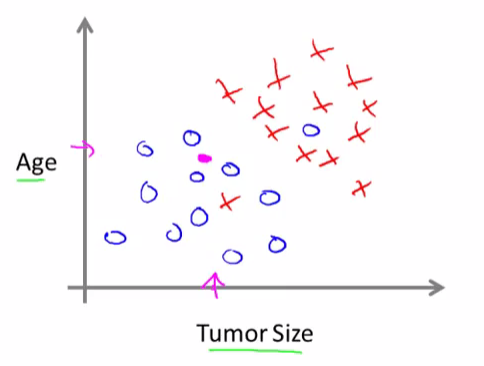
Here’s an example. Let’s say that instead of just knowing the tumor size, we know both the age of the patients and the tumor size. In that case maybe the data set will look like this.

So, let’s say a person who tragically has a tumor. And maybe, their tumor size and age falls around there (rose point):
So given a data set like this, what the learning algorithm might do is throw a straight line through the data to try to separate out the malignant tumors from the benign ones. And with this, hopefully we can decide that the person’s tumor falls on this benign side and is therefore more likely to be benign than malignant.
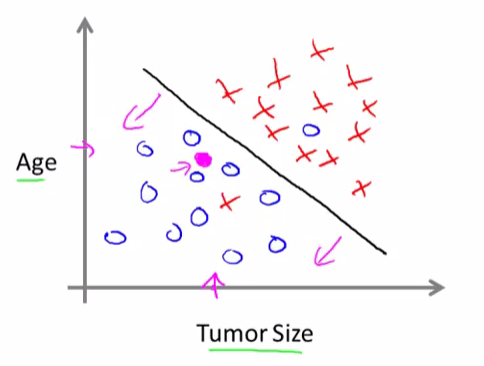
In this example we had two features, namely, the age of the patient and the size of the tumor. In other machine learning problems we will often have more features.
Most interesting learning algorithms is a learning algorithm that can deal with, not just two or three or five features, but an infinite number of features. So how do you deal with an infinite number of features. How do you even store an infinite number of things on the computer when your computer is gonna run out of memory.
Unsupervised Learning
The second major type of machine learning problem is called Unsupervised Learning.
The difference between Unsupervised Learning and Supervised Learning is that in Supervised Learning we are told explicitly what is the so-called right answers (data are labeled).
In Unsupervised Learning, we’re given data that doesn’t have any labels or that all has the same label or really no labels. Like in this example:
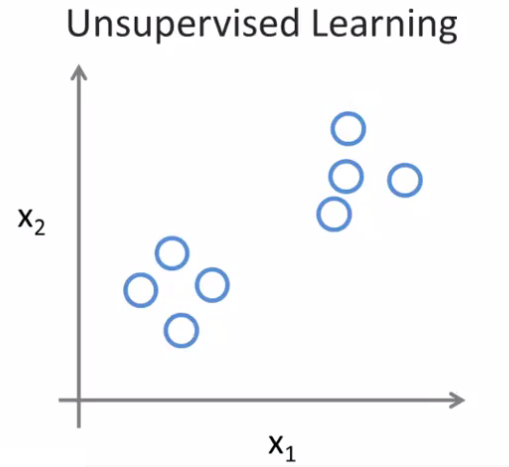
So we’re given the data set and we’re not told what to do with it and we’re not told what each data point is. Instead we’re just told, here is a data set. Can you find some structure in the data?
Given this data set, an Unsupervised Learning algorithm might decide that the data lives in two different clusters.
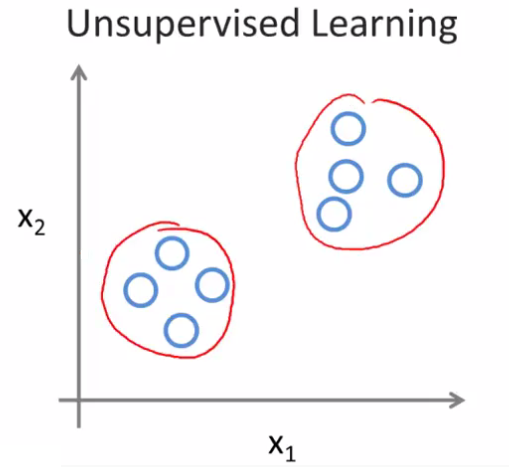
This is called a clustering algorithm.
Here are two examples where Unsupervised Learning or clustering is used.
Social network analysis:
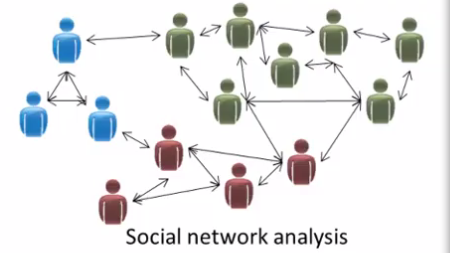
So given knowledge about which friends you email the most or given your Facebook friends or your Google+ circles, can we automatically identify which are cohesive groups of friends, also which are groups of people that all know each other?
Market segmentation:
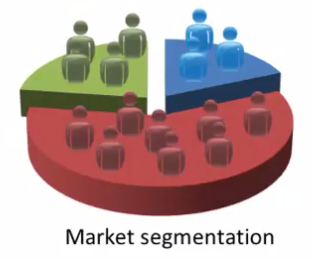
Many companies have huge databases of customer information. So, can you look at this customer data set and automatically discover market segments and automatically group your customers into different market segments so that you can automatically and more efficiently sell or market your different market segments together?
This is Unsupervised Learning because we have all this customer data, but we don’t know in advance what are the market segments and for the customers in our data set, we don’t know in advance who is in market segment one, who is in market segment two, and so on. But we have to let the algorithm discover all this just from the data.
◼