PW 9
Distances dist()
To calculate the distance in we use the dist() function. Here is a tutorial of how use it.
# Generate a matrix M of values from 1 to 15 with 5 rows and 3 columns
M <- matrix(1:15,5,3)
M
#ans>      [,1] [,2] [,3]
#ans> [1,]    1    6   11
#ans> [2,]    2    7   12
#ans> [3,]    3    8   13
#ans> [4,]    4    9   14
#ans> [5,] 5 10 15Dendrogram hclust()
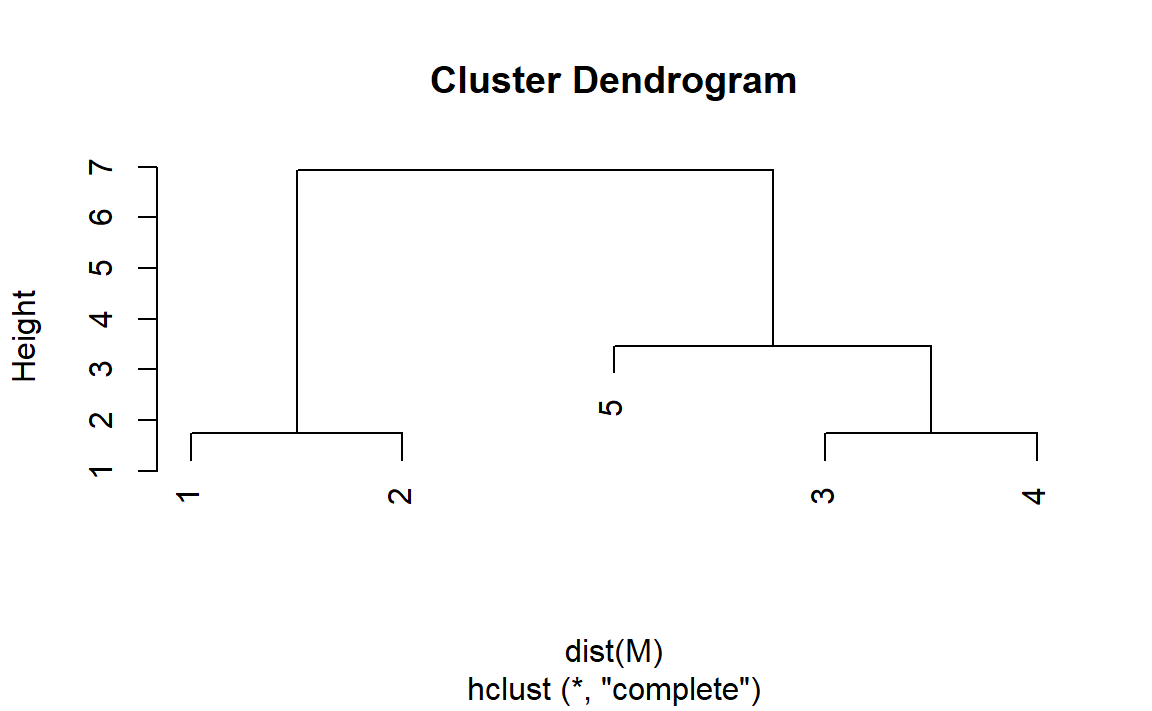
Hierarchical clustering on Iris dataset
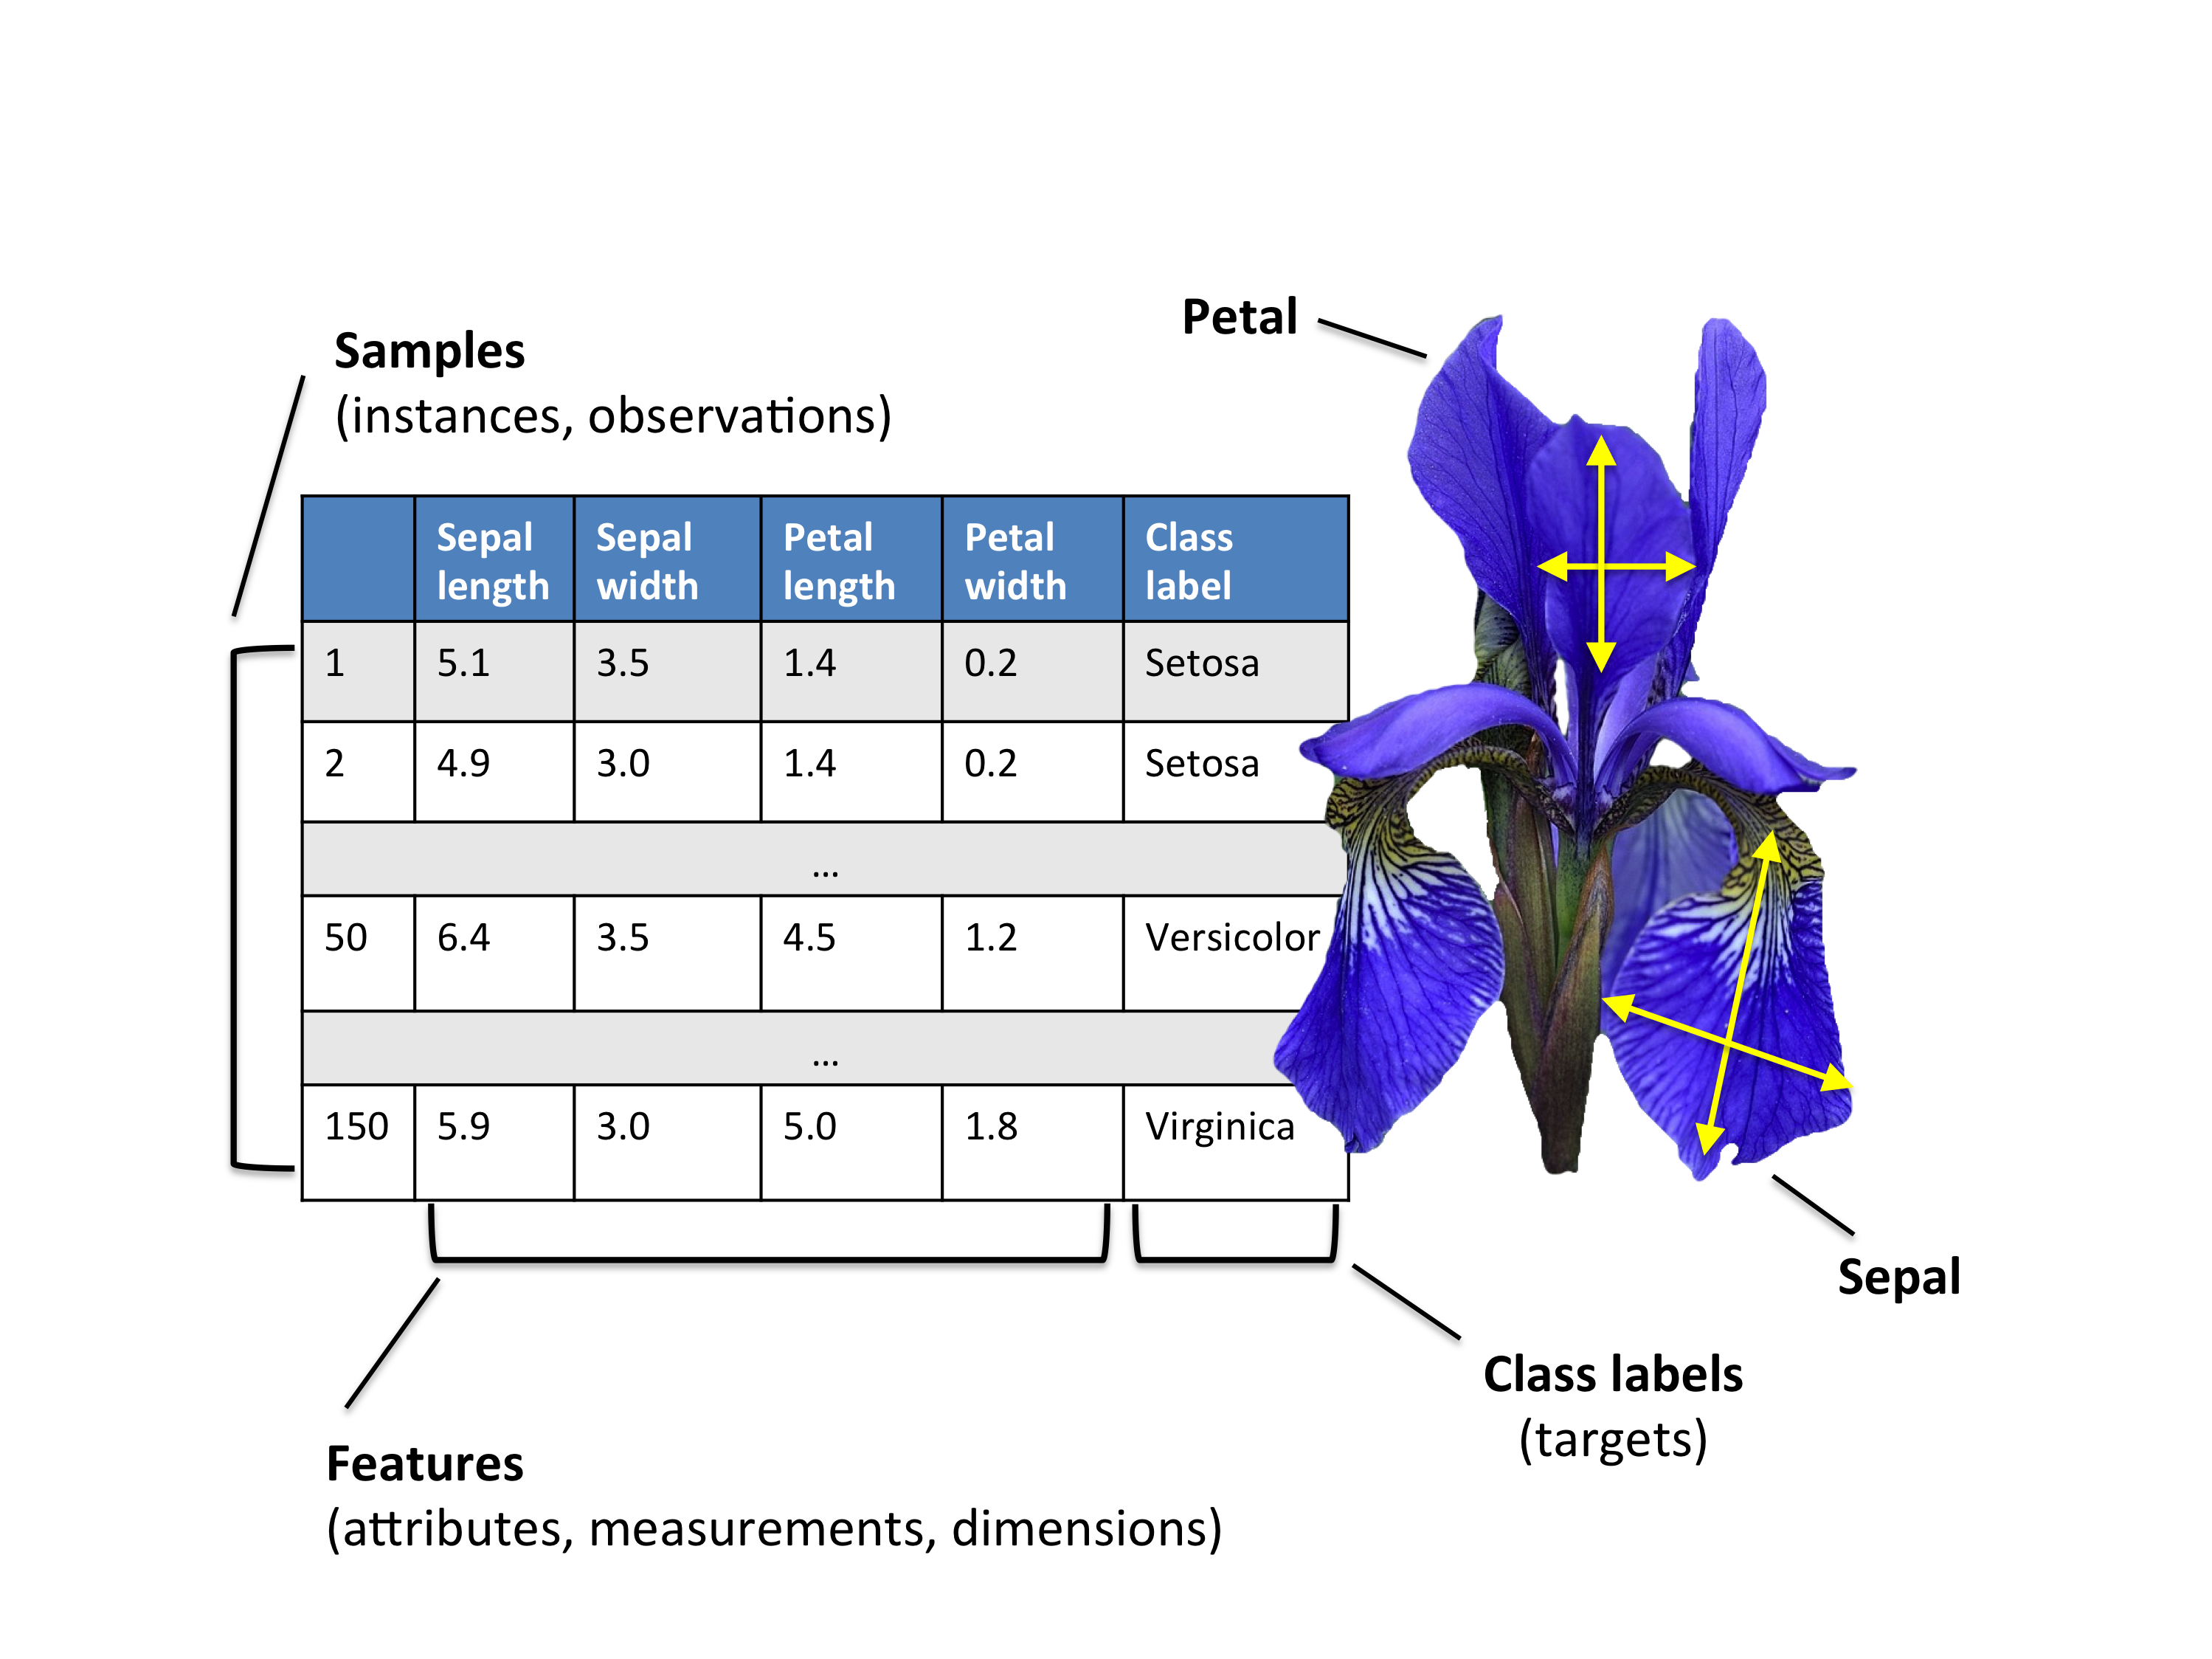
1. Download the iris dataset from here and import it into R.
2. Choose randomly 40 observations of the iris dataset and store the sample dataset into sampleiris.
3. Calculate the euclidean distances between the flowers. Store the results in a matrix called D. (Remark: the last column of the dataset is the class labels of the flowers)
4. Construct a dendrogram on the iris dataset using the method average. Store the result in dendro.avg.
5. Plot the dendrogram.
6. Plot again the dendrogram using the following command:
7. To cut the dendrogram and obtain a clustering use the cutree. You can choose the number of clusters you wish to obtain, or you can cut by choosing the height from the dendrogram figure. Cut the dendrogram in order to obtain 3 clusters. Store the results into vector groups.avg.
8. Visualize the cut tree using the function rect.hclust(). You can choose the colors of the rectangles too!
9. Compare the obtained results obtained with Hierarchical clustering and the real class labels of the flowers (function table()). Interpret the results.
Bonus: You can cut the tree manually (on demand!). To do so, plot a dendrogram first then use the function identify().
On the figure, click on the clusters you wish to obtain. Then hit Escape to finish.
10. Now apply the Hierarchical clustering on the iris dataset (the 150 observations). Choose 3 clusters and compare the results with the real class labels. Compare different methods of Hierarchical clustering (average, complete and single linkages).
◼